

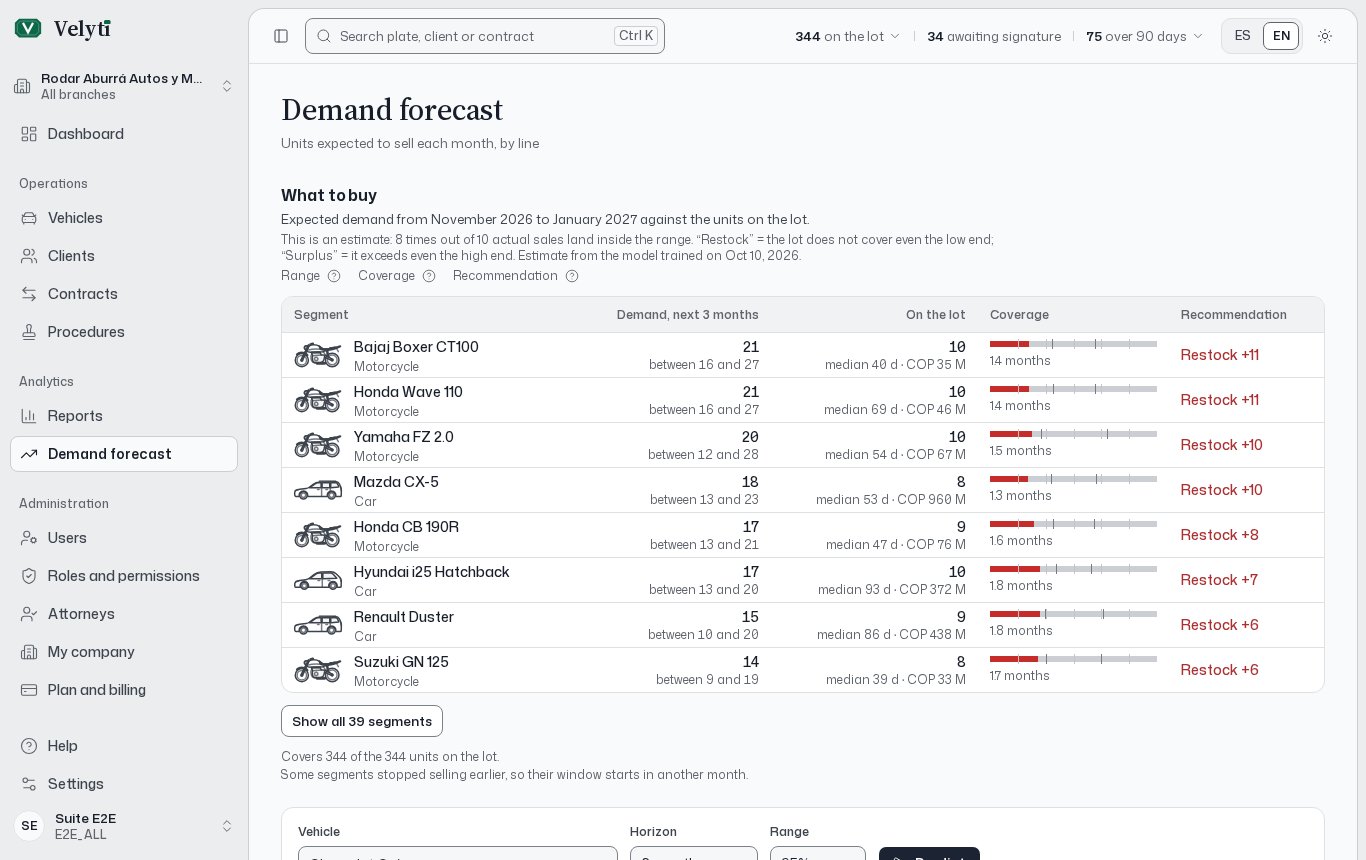
The Demand forecast page.
The forecast needs the Demand forecast module in your plan, and your role needs the Forecast permissions: Predict to see predictions, Retrain to train the model, and Models for the model itself. See Users and roles.
Before the first prediction
The forecast learns from your own sales history. Until someone trains the model, the page says No model has been trained yet and explains that forecasting needs a minimum number of months with contracts recorded.- If your role can retrain, you see Train the model. Training takes several minutes and you can keep working; the app notifies you when it ends (Model ready, or Training failed).
- If your role cannot, the page says that the predictions will appear once an administrator trains the model.
- If your company does not yet have enough months of contracts, the app tells you so. Keep recording contracts and try again later.
Predict a vehicle
1
Choose the vehicle
In Vehicle, search by brand or line. Only segments with enough history to predict are listed. A segment is a brand and line, such as “Mazda CX-5”.
2
Set the horizon
Horizon is how many months ahead to look: 3, 6, 12, 18 or 24. The default is 6.
3
Set the range
Range is the chance that actual sales fall inside the forecast range: 80%, 90%, 95% or 99%. The default is 95%. A wider chance gives a wider range.
4
Press Predict
The result, Expected sales, gives a sentence such as “About N sales expected between two months (approximate range low to high)”, a chart of History and Forecast with the Approximate range band, and a month-by-month table you can open with Show as a table.
What to buy
What to buy compares the expected demand for the next 3 months with the units on the lot, segment by segment. It uses an 80% range: 8 times out of 10, actual sales land inside it.
Each row also shows the demand, what you have on the lot (median days and capital) and the Coverage: how many months of expected sales the lot covers.
Some rows carry a note:
- little history: the segment has few months of sales.
- no sales since a month: the segment stopped selling.
How far to trust it
Model quality shows when the model was trained, its version and its Model reliability: high, medium or low. The reliability depends on how much the model improves on repeating recent sales and how far off it is overall.
The page also shows whether the model beats the naive baseline, which is the best free forecast: repeating the last observed month, or the average of the last three. If the model does not beat it, it adds nothing. Under Technical detail you find the error measures (RMSE, MAE, MAPE, WAPE and R squared), each with a one-line explanation, and What drives the forecast, the relative weight of each variable in the trained model.
Limits to keep in mind
- The model only knows your sales up to the last month it learned. Later months count as no sales, and the page says so and asks you to retrain. If the data is too old, the forecast is paused until the model is retrained.
- A new or rare line has no history, so it is not listed.
- Retrain the model learns again from the whole sales history, takes several minutes and, when it finishes, replaces the current model for every prediction even if its metrics turn out worse. The list of vehicles that can be predicted may change. The app asks you to confirm.
- Only one training runs at a time. If the forecasting service is busy training, or is not available, the app asks you to try again in a few minutes.