

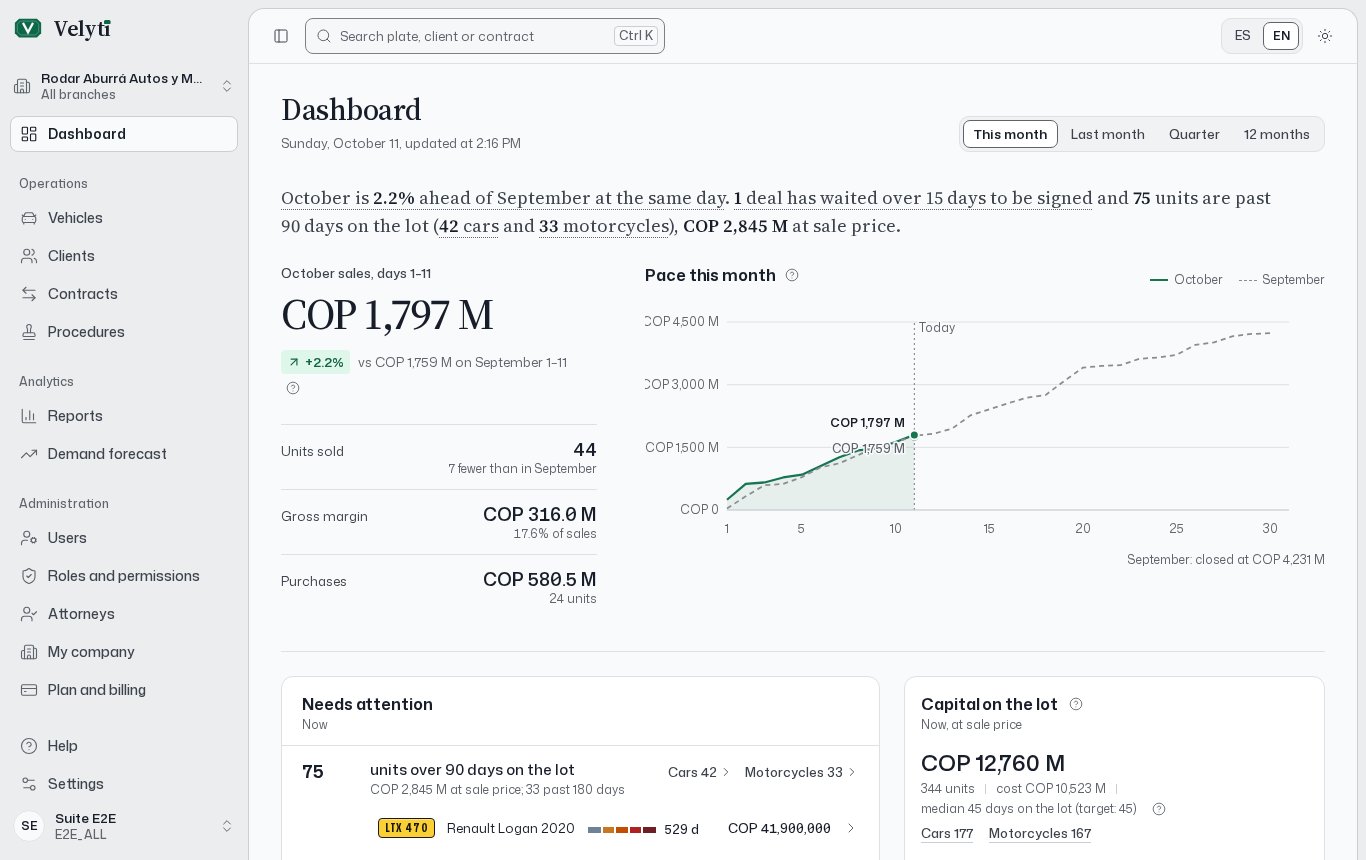
The Dashboard.
Choose the period
Use the Dashboard period selector to change what the sales figures cover.
Only the sales figures, the pace chart and the closed contracts follow the period. Needs attention and Capital on the lot always show how things stand now.
A period in progress is compared with the same stretch of the previous one, not with the whole previous month. September up to the 22nd is compared with August 1 to 22, so a month halfway through does not look slow just for being halfway. The page always says which stretch it compares with and what it was worth. See “Same cut” in the Glossary.
Sales for the period
The top band gives the total of sales for the period and the change against the comparison period. Next to it:- Units sold, with how many more or fewer than in the comparison period.
- Gross margin, with its share of sales. It is the price minus the cost of the units sold, before expenses.
- Purchases, with the number of units bought.
Pace
The pace chart draws the running total of sales day by day and sets it against the comparison period at the same point. A short sentence above it says whether you are ahead of, behind or level with the comparison. A screen reader gets the same information as a summary of the running sales. While the month is running, the chart is drawn only up to Today, and the previous month’s final close is shown apart as a reference.Needs attention
This list gathers what is waiting for someone. Each line opens the full list it counts, through its See all link (with the count), and shows the oldest or worst items.- Units that have been on the lot for a long time, with their value at sale price and how many are past 180 days.
- Deals that are Pending and have waited a long time to be signed.
- Active contracts that have not moved in a long time.
- Units priced below their cost, with the total gap.
- Available units without photos. They sell slower: add the photos from each vehicle’s record.