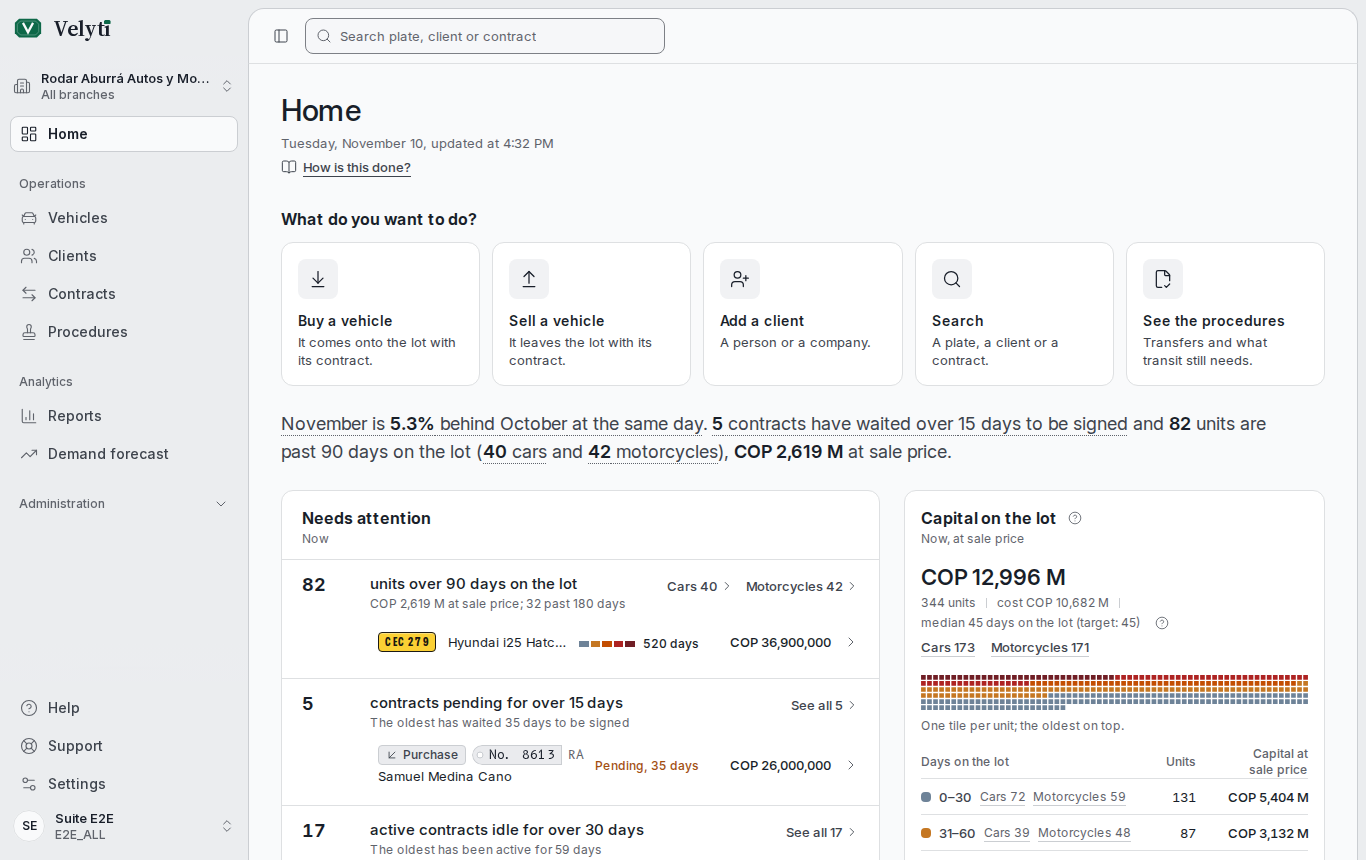
What you can do, what needs attention and how much capital sits on the lot, on one screen.
Home is the first screen most days. It starts with what you can do and goes on to what is happening now: what needs attention and how much money is standing on the lot. The sales figures and the pace chart are in Reports, on the Month’s pace tab.
Home.
It is the first entry of the side menu. The header shows the date and the time it was last updated.
What do you want to do?
The page opens with the everyday tasks, each with its button. You only see the ones your role allows.
Below them, a sentence sums up how the month is going and what is waiting. Its underlined figures open the list they count.
Needs attention
This list gathers what is waiting for someone. Each line opens the full list it counts, through its See all link (with the count), and shows the oldest or worst item of each group.
Units that have been on the lot for a long time, with their value at sale price and how many are past 180 days.
Contracts that are Pending and have waited a long time to be signed.
Active contracts that have not moved in a long time.
Units priced below their cost, with the total gap.
Available units without photos. They sell slower: add the photos from each vehicle’s record.
When nothing qualifies, the card says Nothing needs attention right now. See Vehicles and Contracts to act on each line.
Capital on the lot
Shows what everything not yet sold is worth at sale price, how many units that is (split into cars and motorcycles), what they cost, and the median days on the lot against the target.
Capital on the lot is not a loss and not the cost. It is the sale price of what you still hold, and it falls as units sell.
Contracts
Counts by status: Pending and Active as they stand now; Completed and Canceled within the chosen period. It also shows what share of the closed contracts were canceled and lists Recent contracts, with See all contracts to open the full list.
If a section does not load
Each block loads on its own. If one fails, it says This section could not be loaded and the rest of the page keeps working. Reload to try again.
For the full breakdown behind these figures, by month, brand or client, go to Reports.
{"docsConfig":{"theme":"mint","$schema":"https://mintlify.com/docs.json","name":"Velyti","colors":{"primary":"#0d6848","light":"#6ccaa0","dark":"#0d6848"},"logo":{"light":"https://mintcdn.com/steven-org/Veqecz06SlGfVx7e/logo/light.svg?fit=max\u0026auto=format\u0026n=Veqecz06SlGfVx7e\u0026q=85\u0026s=7253b35b9719abe01c9fa1a0ce9e2437","dark":"https://mintcdn.com/steven-org/Veqecz06SlGfVx7e/logo/dark.svg?fit=max\u0026auto=format\u0026n=Veqecz06SlGfVx7e\u0026q=85\u0026s=02caf109b16d313cb125adfb0f2d2522"},"favicon":"https://mintcdn.com/steven-org/Veqecz06SlGfVx7e/favicon.svg?fit=max\u0026auto=format\u0026n=Veqecz06SlGfVx7e\u0026q=85\u0026s=e45b7f7a06560689ff3ca01abf016172","styling":{"latex":false},"navigation":{"languages":[{"language":"es","default":true,"href":"es"},{"language":"en","href":"en"}]}},"deployment":{"deploymentMetadataValue":{"subdomain":"steven-org","hasAudioNarration":false,"actualSubdomain":"steven-org","customDomains":["docs.velyti.com"],"gitSource":{"type":"github","owner":"stevenrq","repo":"velyti","deployBranch":"main","contentDirectory":"velyti-docs","isPrivate":true,"mountPath":"","label":""},"entitlements":{"AI_CHAT":{"status":"DISABLED"},"WEB_MCP":{"status":"DISABLED"},"NARRATION":{"status":"DISABLED"}},"buildId":"6af4b841d7a808c67a4ab98c","clientVersion":"0.0.4143","searchFilterCounts":[{"language":"en","tag":"Administration","count":5},{"language":"es","tag":"Administración","count":5},{"language":"en","tag":"Get started","count":4},{"language":"es","tag":"Para empezar","count":4},{"language":"en","tag":"Contracts","count":3},{"language":"en","tag":"Insights","count":3},{"language":"es","tag":"Compraventas","count":3},{"language":"es","tag":"Análisis","count":3},{"language":"en","tag":"Help","count":2},{"language":"en","tag":"Inventory","count":2},{"language":"es","tag":"Ayuda","count":2},{"language":"es","tag":"Inventario","count":2},{"language":"en","tag":"Clients","count":1},{"language":"en","tag":"Procedures","count":1},{"language":"es","tag":"Clientes","count":1},{"language":"es","tag":"Trámites","count":1}]},"assistantConfig":{"enableAskAiButton":false,"enableStarterQuestions":false,"enableContextualStarterQuestions":false,"enableAskAiSearchBar":true},"basePath":"","hasChatPermissions":false,"hasWebMcpPermissions":false,"toggles":[{"name":"kill-isr","enabled":true,"variant":{"name":"disabled","enabled":false,"feature_enabled":true},"impressionData":false},{"name":"custom-rbac-roles","enabled":true,"variant":{"name":"disabled","enabled":false,"feature_enabled":true},"impressionData":false},{"name":"agent-mintlify-slack","enabled":true,"variant":{"name":"disabled","enabled":false,"feature_enabled":true},"impressionData":false},{"name":"agent-integrations-settings","enabled":true,"variant":{"name":"disabled","enabled":false,"feature_enabled":true},"impressionData":false},{"name":"rbac-expansion","enabled":true,"variant":{"name":"disabled","enabled":false,"feature_enabled":true},"impressionData":false},{"name":"automations-pr-grouping","enabled":true,"variant":{"name":"disabled","enabled":false,"feature_enabled":true},"impressionData":false},{"name":"custom-prefix","enabled":true,"variant":{"name":"disabled","enabled":false,"feature_enabled":true},"impressionData":false},{"name":"analytics-v7","enabled":true,"variant":{"name":"disabled","enabled":false,"feature_enabled":true},"impressionData":false},{"name":"user-flows-analytics","enabled":true,"variant":{"name":"disabled","enabled":false,"feature_enabled":true},"impressionData":false},{"name":"no-publish-flow","enabled":true,"variant":{"name":"disabled","enabled":false,"feature_enabled":true},"impressionData":false},{"name":"workos-onboarding","enabled":true,"variant":{"name":"disabled","enabled":false,"feature_enabled":true},"impressionData":false},{"name":"snapshot-serving-live","enabled":true,"variant":{"name":"disabled","enabled":false,"feature_enabled":true},"impressionData":false},{"name":"stripTemperatureMiddleware","enabled":true,"variant":{"name":"disabled","enabled":false,"feature_enabled":true},"impressionData":false},{"name":"support-platform-pylon-zendesk","enabled":true,"variant":{"name":"disabled","enabled":false,"feature_enabled":true},"impressionData":false},{"name":"snapshot-serving","enabled":true,"variant":{"name":"disabled","enabled":false,"feature_enabled":true},"impressionData":false},{"name":"instant-rollback","enabled":true,"variant":{"name":"disabled","enabled":false,"feature_enabled":true},"impressionData":false},{"name":"granular-notifications-server","enabled":true,"variant":{"name":"disabled","enabled":false,"feature_enabled":true},"impressionData":false},{"name":"granular-notifications","enabled":true,"variant":{"name":"disabled","enabled":false,"feature_enabled":true},"impressionData":false},{"name":"automations-fable","enabled":true,"variant":{"name":"disabled","enabled":false,"feature_enabled":true},"impressionData":false},{"name":"fixed-ai-action-pricing","enabled":true,"variant":{"name":"disabled","enabled":false,"feature_enabled":true},"impressionData":false},{"name":"automation-resolve-merge-conflict","enabled":true,"variant":{"name":"disabled","enabled":false,"feature_enabled":true},"impressionData":false},{"name":"scoped-publishing","enabled":true,"variant":{"name":"disabled","enabled":false,"feature_enabled":true},"impressionData":false},{"name":"mintql","enabled":true,"variant":{"name":"disabled","enabled":false,"feature_enabled":true},"impressionData":false},{"name":"page-level-analytics","enabled":true,"variant":{"name":"disabled","enabled":false,"feature_enabled":true},"impressionData":false},{"name":"editor-version-history-v2","enabled":true,"variant":{"name":"disabled","enabled":false,"feature_enabled":true},"impressionData":false},{"name":"billing-page-v2","enabled":true,"variant":{"name":"disabled","enabled":false,"feature_enabled":true},"impressionData":false},{"name":"full-page-search","enabled":true,"variant":{"name":"disabled","enabled":false,"feature_enabled":true},"impressionData":false},{"name":"workspace-projects","enabled":true,"variant":{"name":"disabled","enabled":false,"feature_enabled":true},"impressionData":false},{"name":"assistant-v5","enabled":true,"variant":{"name":"disabled","enabled":false,"feature_enabled":true},"impressionData":false},{"name":"fork-pr-previews","enabled":true,"variant":{"name":"disabled","enabled":false,"feature_enabled":true},"impressionData":false},{"name":"revalidation-jwt","enabled":true,"variant":{"name":"disabled","enabled":false,"feature_enabled":true},"impressionData":false},{"name":"workos-sso-scim","enabled":true,"variant":{"name":"disabled","enabled":false,"feature_enabled":true},"impressionData":false},{"name":"hobby-abuse-scan","enabled":true,"variant":{"name":"disabled","enabled":false,"feature_enabled":true},"impressionData":false},{"name":"dashboard-inbox","enabled":true,"variant":{"name":"disabled","enabled":false,"feature_enabled":true},"impressionData":false},{"name":"workos-signup","enabled":true,"variant":{"name":"disabled","enabled":false,"feature_enabled":true},"impressionData":false},{"name":"turbopuffer-dual-write","enabled":true,"variant":{"name":"disabled","enabled":false,"feature_enabled":true},"impressionData":false},{"name":"workos-enabled","enabled":true,"variant":{"name":"disabled","enabled":false,"feature_enabled":true},"impressionData":false},{"name":"approve-review-flow","enabled":true,"variant":{"name":"disabled","enabled":false,"feature_enabled":true},"impressionData":false},{"name":"editor-metadata","enabled":true,"variant":{"name":"disabled","enabled":false,"feature_enabled":true},"impressionData":false},{"name":"sso-setup-deadline-banner","enabled":true,"variant":{"name":"disabled","enabled":false,"feature_enabled":true},"impressionData":false},{"name":"turbopuffer-serve","enabled":true,"variant":{"name":"disabled","enabled":false,"feature_enabled":true},"impressionData":false},{"name":"live-agents","enabled":true,"variant":{"name":"disabled","enabled":false,"feature_enabled":true},"impressionData":false},{"name":"llms-txt-v2","enabled":true,"variant":{"name":"disabled","enabled":false,"feature_enabled":true},"impressionData":false}],"googleFontsInlined":false},"customCss":[],"page":{"pagePath":"en/insights/dashboard","slug":"/en/insights/dashboard","pageMetadata":{"title":"Home","description":"What you can do, what needs attention and how much capital sits on the lot, on one screen.","icon":"gauge","href":"/en/insights/dashboard"},"description":{"compiledSource":"\"use strict\";\nconst {jsx: _jsx} = arguments[0];\nconst {useMDXComponents: _provideComponents} = arguments[0];\nfunction _createMdxContent(props) {\n const _components = {\n p: \"p\",\n ..._provideComponents(),\n ...props.components\n };\n return _jsx(_components.p, {\n children: \"What you can do, what needs attention and how much capital sits on the lot, on one screen.\"\n });\n}\nfunction MDXContent(props = {}) {\n const {wrapper: MDXLayout} = {\n ..._provideComponents(),\n ...props.components\n };\n return MDXLayout ? _jsx(MDXLayout, {\n ...props,\n children: _jsx(_createMdxContent, {\n ...props\n })\n }) : _createMdxContent(props);\n}\nreturn {\n default: MDXContent\n};\n","frontmatter":{},"scope":{}},"pageType":"default","mdx":{"mdxSource":{"compiledSource":"\"use strict\";const{Fragment:_Fragment,jsx:_jsx,jsxs:_jsxs}=arguments[0];const{useMDXComponents:_provideComponents}=arguments[0];function _createMdxContent(props){const _components={a:`a`,li:`li`,p:`p`,strong:`strong`,tbody:`tbody`,td:`td`,th:`th`,thead:`thead`,tr:`tr`,ul:`ul`,..._provideComponents(),...props.components},{Frame,Heading,OptimizedImage,Table,Tip,Warning}=_components;if(!Frame)_missingMdxReference(`Frame`,true);if(!Heading)_missingMdxReference(`Heading`,true);if(!OptimizedImage)_missingMdxReference(`OptimizedImage`,true);if(!Table)_missingMdxReference(`Table`,true);if(!Tip)_missingMdxReference(`Tip`,true);if(!Warning)_missingMdxReference(`Warning`,true);return _jsxs(_Fragment,{children:[_jsxs(_components.p,{children:[_jsx(_components.strong,{children:`Home`}),` is the first screen most days. It starts with what you can do and goes on to what is happening now: what needs attention and how much money is standing on the lot. The sales figures and the pace chart are in `,_jsx(_components.a,{href:`/en/insights/reports`,children:`Reports`}),`, on the `,_jsx(_components.strong,{children:`Month’s pace`}),` tab.`]}),`\n`,_jsx(Frame,{caption:`Home.`,children:_jsx(OptimizedImage,{src:`https://mintcdn.com/steven-org/EdymqxKV5FubVYmB/images/en/dashboard.png?fit=max\u0026auto=format\u0026n=EdymqxKV5FubVYmB\u0026q=85\u0026s=d3a7b9e6fdf497e91ba0a67a4a5b448c`,alt:`Home.`,\"data-og-width\":`1366`,width:`1366`,\"data-og-height\":`860`,height:`860`,\"data-path\":`images/en/dashboard.png`,\"data-optimize\":`true`,\"data-opv\":`3`,srcset:`https://mintcdn.com/steven-org/EdymqxKV5FubVYmB/images/en/dashboard.png?w=280\u0026fit=max\u0026auto=format\u0026n=EdymqxKV5FubVYmB\u0026q=85\u0026s=c0d6786151d7b6880a8cb2a212ad2276 280w, https://mintcdn.com/steven-org/EdymqxKV5FubVYmB/images/en/dashboard.png?w=560\u0026fit=max\u0026auto=format\u0026n=EdymqxKV5FubVYmB\u0026q=85\u0026s=8659ff10dde7ab5639ca1d1a71cf8c7c 560w, https://mintcdn.com/steven-org/EdymqxKV5FubVYmB/images/en/dashboard.png?w=840\u0026fit=max\u0026auto=format\u0026n=EdymqxKV5FubVYmB\u0026q=85\u0026s=65ff80ff71c23bdf882a8b8f260c60bc 840w, https://mintcdn.com/steven-org/EdymqxKV5FubVYmB/images/en/dashboard.png?w=1100\u0026fit=max\u0026auto=format\u0026n=EdymqxKV5FubVYmB\u0026q=85\u0026s=c8312839979ffef39c6d9507cf9fbc19 1100w, https://mintcdn.com/steven-org/EdymqxKV5FubVYmB/images/en/dashboard.png?w=1650\u0026fit=max\u0026auto=format\u0026n=EdymqxKV5FubVYmB\u0026q=85\u0026s=c929dcc0b6e312916804a15559f6d244 1650w, https://mintcdn.com/steven-org/EdymqxKV5FubVYmB/images/en/dashboard.png?w=2500\u0026fit=max\u0026auto=format\u0026n=EdymqxKV5FubVYmB\u0026q=85\u0026s=008b4933c7ac64a3091d29c94aa6aa60 2500w`})}),`\n`,_jsx(_components.p,{children:`It is the first entry of the side menu. The header shows the date and the time it was last updated.`}),`\n`,_jsx(Heading,{level:`2`,id:`what-do-you-want-to-do`,children:`What do you want to do?`}),`\n`,_jsx(_components.p,{children:`The page opens with the everyday tasks, each with its button. You only see the ones your role allows.`}),`\n`,_jsxs(Table,{children:[_jsx(_components.thead,{children:_jsxs(_components.tr,{children:[_jsx(_components.th,{children:`Button`}),_jsx(_components.th,{children:`What it opens`})]})}),_jsxs(_components.tbody,{children:[_jsxs(_components.tr,{children:[_jsx(_components.td,{children:_jsx(_components.strong,{children:`Buy a vehicle`})}),_jsxs(_components.td,{children:[`A new purchase, a step at a time. See `,_jsx(_components.a,{href:`/en/contracts/contracts`,children:`Contracts`}),`.`]})]}),_jsxs(_components.tr,{children:[_jsx(_components.td,{children:_jsx(_components.strong,{children:`Sell a vehicle`})}),_jsx(_components.td,{children:`A new sale, a step at a time.`})]}),_jsxs(_components.tr,{children:[_jsx(_components.td,{children:_jsx(_components.strong,{children:`Add a client`})}),_jsxs(_components.td,{children:[`The form of a new client. See `,_jsx(_components.a,{href:`/en/clients/clients`,children:`Clients`}),`.`]})]}),_jsxs(_components.tr,{children:[_jsx(_components.td,{children:_jsx(_components.strong,{children:`Search`})}),_jsx(_components.td,{children:`The search box, for a plate, a client or a contract.`})]}),_jsxs(_components.tr,{children:[_jsx(_components.td,{children:_jsx(_components.strong,{children:`See the procedures`})}),_jsxs(_components.td,{children:[`The list of procedures. See `,_jsx(_components.a,{href:`/en/procedures/procedures`,children:`Procedures`}),`.`]})]})]})]}),`\n`,_jsx(_components.p,{children:`Below them, a sentence sums up how the month is going and what is waiting. Its underlined figures open the list they count.`}),`\n`,_jsx(Heading,{level:`2`,id:`needs-attention`,children:`Needs attention`}),`\n`,_jsxs(_components.p,{children:[`This list gathers what is waiting for someone. Each line opens the full list it counts, through its `,_jsx(_components.strong,{children:`See all`}),` link (with the count), and shows the oldest or worst item of each group.`]}),`\n`,_jsxs(_components.ul,{children:[`\n`,_jsx(_components.li,{children:`Units that have been on the lot for a long time, with their value at sale price and how many are past 180 days.`}),`\n`,_jsxs(_components.li,{children:[`Contracts that are `,_jsx(_components.strong,{children:`Pending`}),` and have waited a long time to be signed.`]}),`\n`,_jsxs(_components.li,{children:[_jsx(_components.strong,{children:`Active`}),` contracts that have not moved in a long time.`]}),`\n`,_jsx(_components.li,{children:`Units priced below their cost, with the total gap.`}),`\n`,_jsx(_components.li,{children:`Available units without photos. They sell slower: add the photos from each vehicle’s record.`}),`\n`]}),`\n`,_jsxs(_components.p,{children:[`When nothing qualifies, the card says `,_jsx(_components.strong,{children:`Nothing needs attention right now`}),`. See `,_jsx(_components.a,{href:`/en/inventory/vehicles`,children:`Vehicles`}),` and `,_jsx(_components.a,{href:`/en/contracts/contracts`,children:`Contracts`}),` to act on each line.`]}),`\n`,_jsx(Heading,{level:`2`,id:`capital-on-the-lot`,children:`Capital on the lot`}),`\n`,_jsx(_components.p,{children:`Shows what everything not yet sold is worth at sale price, how many units that is (split into cars and motorcycles), what they cost, and the median days on the lot against the target.`}),`\n`,_jsx(Warning,{children:_jsx(_components.p,{children:`Capital on the lot is not a loss and not the cost. It is the sale price of what you still hold, and it falls as units sell.`})}),`\n`,_jsx(Heading,{level:`2`,id:`contracts`,children:`Contracts`}),`\n`,_jsxs(_components.p,{children:[`Counts by status: `,_jsx(_components.strong,{children:`Pending`}),` and `,_jsx(_components.strong,{children:`Active`}),` as they stand now; `,_jsx(_components.strong,{children:`Completed`}),` and `,_jsx(_components.strong,{children:`Canceled`}),` within the chosen period. It also shows what share of the closed contracts were canceled and lists `,_jsx(_components.strong,{children:`Recent contracts`}),`, with `,_jsx(_components.strong,{children:`See all contracts`}),` to open the full list.`]}),`\n`,_jsx(Heading,{level:`2`,id:`if-a-section-does-not-load`,children:`If a section does not load`}),`\n`,_jsxs(_components.p,{children:[`Each block loads on its own. If one fails, it says `,_jsx(_components.strong,{children:`This section could not be loaded`}),` and the rest of the page keeps working. Reload to try again.`]}),`\n`,_jsx(Tip,{children:_jsxs(_components.p,{children:[`For the full breakdown behind these figures, by month, brand or client, go to `,_jsx(_components.a,{href:`/en/insights/reports`,children:`Reports`}),`.`]})})]})}function MDXContent(props={}){const{wrapper:MDXLayout}={..._provideComponents(),...props.components};return MDXLayout?_jsx(MDXLayout,{...props,children:_jsx(_createMdxContent,{...props})}):_createMdxContent(props)}return{default:MDXContent};function _missingMdxReference(id,component){throw new Error(`Expected `+(component?`component`:`object`)+\" `\"+id+\"` to be defined: you likely forgot to import, pass, or provide it.\")}","frontmatter":{},"scope":{"config":{},"pageMetadata":{"title":"Home","description":"What you can do, what needs attention and how much capital sits on the lot, on one screen.","icon":"gauge","href":"/en/insights/dashboard"}}},"mdxSourceWithNoJs":null},"mdxExtracts":{"tableOfContents":[{"title":"What do you want to do?","slug":"what-do-you-want-to-do","depth":2,"children":[]},{"title":"Needs attention","slug":"needs-attention","depth":2,"children":[]},{"title":"Capital on the lot","slug":"capital-on-the-lot","depth":2,"children":[]},{"title":"Contracts","slug":"contracts","depth":2,"children":[]},{"title":"If a section does not load","slug":"if-a-section-does-not-load","depth":2,"children":[]}],"codeExamples":{}},"jsLinks":[],"subdomain":"steven-org","siteName":"Velyti","title":"Home - Velyti","navMaps":{"firstHrefInVersion":{},"firstHrefInLanguage":{"es":{"href":"/es/insights/dashboard","matchLevel":1},"en":{"href":"/en/insights/dashboard","matchLevel":0}}},"lastModified":"2026-11-10T23:23:46.514Z","originalFileLocation":"en/insights/dashboard.mdx","locale":"en"},"headHtml":"\u003cscript data-mint-head>(function(){var d=document.documentElement,p=null;if(!p){try{p=localStorage.getItem(\"isDarkMode\")}catch(e){}if(p==='true')p='dark';else if(p==='false')p='light';if(p!=='light'\u0026\u0026p!=='dark'\u0026\u0026p!=='system')p=\"system\"}var r=p==='system'?(matchMedia(\"(prefers-color-scheme: dark)\").matches?'dark':'light'):p;d.classList.remove(r==='dark'?'light':'dark');d.classList.add(r);d.setAttribute(\"data-theme-preference\",p)})();\u003c/script>\u003cmeta data-mint-head name=\"description\" content=\"What you can do, what needs attention and how much capital sits on the lot, on one screen.\">\u003cmeta data-mint-head name=\"application-name\" content=\"Velyti\">\u003cmeta data-mint-head name=\"generator\" content=\"Mintlify\">\u003clink data-mint-head rel=\"icon\" type=\"image/png\" sizes=\"192x192\" href=\"/mintlify-assets/_mintlify/favicons/steven-org/-Q2Jpe4qQzZcJcAK/_generated/favicon/android-chrome-192x192.png\" media=\"(prefers-color-scheme: light)\">\u003clink data-mint-head rel=\"apple-touch-icon\" type=\"image/png\" sizes=\"180x180\" href=\"/mintlify-assets/_mintlify/favicons/steven-org/-Q2Jpe4qQzZcJcAK/_generated/favicon/apple-touch-icon.png\">\u003clink data-mint-head rel=\"icon\" type=\"image/png\" sizes=\"16x16\" href=\"/mintlify-assets/_mintlify/favicons/steven-org/-Q2Jpe4qQzZcJcAK/_generated/favicon/favicon-16x16.png\" media=\"(prefers-color-scheme: light)\">\u003clink data-mint-head rel=\"icon\" type=\"image/png\" sizes=\"32x32\" href=\"/mintlify-assets/_mintlify/favicons/steven-org/-Q2Jpe4qQzZcJcAK/_generated/favicon/favicon-32x32.png\" media=\"(prefers-color-scheme: light)\">\u003clink data-mint-head rel=\"shortcut icon\" type=\"image/x-icon\" href=\"/mintlify-assets/_mintlify/favicons/steven-org/-Q2Jpe4qQzZcJcAK/_generated/favicon/favicon.ico\" media=\"(prefers-color-scheme: light)\">\u003clink data-mint-head rel=\"icon\" type=\"image/png\" sizes=\"192x192\" href=\"/mintlify-assets/_mintlify/favicons/steven-org/-Q2Jpe4qQzZcJcAK/_generated/favicon-dark/android-chrome-192x192.png\" media=\"(prefers-color-scheme: dark)\">\u003clink data-mint-head rel=\"icon\" type=\"image/png\" sizes=\"16x16\" href=\"/mintlify-assets/_mintlify/favicons/steven-org/-Q2Jpe4qQzZcJcAK/_generated/favicon-dark/favicon-16x16.png\" media=\"(prefers-color-scheme: dark)\">\u003clink data-mint-head rel=\"icon\" type=\"image/png\" sizes=\"32x32\" href=\"/mintlify-assets/_mintlify/favicons/steven-org/-Q2Jpe4qQzZcJcAK/_generated/favicon-dark/favicon-32x32.png\" media=\"(prefers-color-scheme: dark)\">\u003clink data-mint-head rel=\"shortcut icon\" type=\"image/x-icon\" href=\"/mintlify-assets/_mintlify/favicons/steven-org/-Q2Jpe4qQzZcJcAK/_generated/favicon-dark/favicon.ico\" media=\"(prefers-color-scheme: dark)\">\u003cmeta data-mint-head property=\"og:title\" content=\"Home - Velyti\">\u003cmeta data-mint-head property=\"og:description\" content=\"What you can do, what needs attention and how much capital sits on the lot, on one screen.\">\u003cmeta data-mint-head property=\"og:site_name\" content=\"Velyti\">\u003cmeta data-mint-head property=\"og:url\" content=\"https://docs.velyti.com/en/insights/dashboard\">\u003cmeta data-mint-head property=\"og:type\" content=\"website\">\u003cmeta data-mint-head property=\"og:image\" content=\"https://steven-org.mintlify.site/_mintlify/api/og/v2?division=Insights\u0026amp;title=Home\u0026amp;description=What+you+can+do%2C+what+needs+attention+and+how+much+capital+sits+on+the+lot%2C+on+one+screen.\u0026amp;theme=6bd1de77213c195175e33da0\u0026amp;signature=b347be288ea65723a68174d9f984d2651118d0da1e240e404f446babc257b177\">\u003cmeta data-mint-head property=\"og:image:width\" content=\"1200\">\u003cmeta data-mint-head property=\"og:image:height\" content=\"630\">\u003cmeta data-mint-head name=\"twitter:card\" content=\"summary_large_image\">\u003cmeta data-mint-head name=\"twitter:title\" content=\"Home - Velyti\">\u003cmeta data-mint-head name=\"twitter:description\" content=\"What you can do, what needs attention and how much capital sits on the lot, on one screen.\">\u003cmeta data-mint-head name=\"twitter:image\" content=\"https://steven-org.mintlify.site/_mintlify/api/og/v2?division=Insights\u0026amp;title=Home\u0026amp;description=What+you+can+do%2C+what+needs+attention+and+how+much+capital+sits+on+the+lot%2C+on+one+screen.\u0026amp;theme=6bd1de77213c195175e33da0\u0026amp;signature=b347be288ea65723a68174d9f984d2651118d0da1e240e404f446babc257b177\">\u003cmeta data-mint-head name=\"twitter:image:width\" content=\"1200\">\u003cmeta data-mint-head name=\"twitter:image:height\" content=\"630\">\u003cmeta data-mint-head name=\"msapplication-config\" content=\"/mintlify-assets/_mintlify/favicons/steven-org/-Q2Jpe4qQzZcJcAK/_generated/favicon/browserconfig.xml\">\u003cmeta data-mint-head name=\"apple-mobile-web-app-title\" content=\"Velyti\">\u003cmeta data-mint-head name=\"msapplication-TileColor\" content=\"#0d6848\">\u003clink data-mint-head rel=\"canonical\" href=\"https://docs.velyti.com/en/insights/dashboard\">\u003clink data-mint-head rel=\"alternate\" type=\"application/xml\" href=\"/sitemap.xml\">\u003clink data-mint-head rel=\"alternate\" type=\"text/markdown\" href=\"/en/insights/dashboard.md\">\u003clink data-mint-head rel=\"alternate\" hreflang=\"en\" href=\"https://docs.velyti.com/en/insights/dashboard\">\u003clink data-mint-head rel=\"alternate\" hreflang=\"es\" href=\"https://docs.velyti.com/es/insights/dashboard\">\u003clink data-mint-head rel=\"alternate\" hreflang=\"x-default\" href=\"https://docs.velyti.com/es/insights/dashboard\">\u003cscript data-mint-head type=\"application/ld+json\">{\"@context\":\"https://schema.org\",\"@graph\":[{\"@type\":\"Organization\",\"@id\":\"https://docs.velyti.com/#organization\",\"name\":\"Velyti\",\"url\":\"https://docs.velyti.com\",\"logo\":{\"@type\":\"ImageObject\",\"url\":\"https://mintcdn.com/steven-org/Veqecz06SlGfVx7e/logo/light.svg?fit=max\u0026auto=format\u0026n=Veqecz06SlGfVx7e\u0026q=85\u0026s=7253b35b9719abe01c9fa1a0ce9e2437\"}},{\"@type\":\"WebSite\",\"@id\":\"https://docs.velyti.com#website\",\"name\":\"Velyti\",\"url\":\"https://docs.velyti.com\",\"publisher\":{\"@id\":\"https://docs.velyti.com/#organization\"}},{\"@type\":\"WebPage\",\"@id\":\"https://docs.velyti.com/en/insights/dashboard#webpage\",\"url\":\"https://docs.velyti.com/en/insights/dashboard\",\"name\":\"Home\",\"description\":\"What you can do, what needs attention and how much capital sits on the lot, on one screen.\",\"dateModified\":\"2026-11-10T23:23:46.514Z\",\"isPartOf\":{\"@id\":\"https://docs.velyti.com#website\"},\"breadcrumb\":{\"@id\":\"https://docs.velyti.com/en/insights/dashboard#breadcrumb\"}},{\"@type\":\"BreadcrumbList\",\"@id\":\"https://docs.velyti.com/en/insights/dashboard#breadcrumb\",\"itemListElement\":[{\"@type\":\"ListItem\",\"position\":1,\"name\":\"Velyti\",\"item\":\"https://docs.velyti.com\"},{\"@type\":\"ListItem\",\"position\":2,\"name\":\"Home\",\"item\":\"https://docs.velyti.com/en/insights/dashboard\"}]},{\"@type\":[\"Article\",\"TechArticle\"],\"@id\":\"https://docs.velyti.com/en/insights/dashboard#article\",\"headline\":\"Home\",\"name\":\"Home\",\"description\":\"What you can do, what needs attention and how much capital sits on the lot, on one screen.\",\"url\":\"https://docs.velyti.com/en/insights/dashboard\",\"mainEntityOfPage\":{\"@id\":\"https://docs.velyti.com/en/insights/dashboard#webpage\"},\"dateModified\":\"2026-11-10T23:23:46.514Z\",\"publisher\":{\"@id\":\"https://docs.velyti.com/#organization\"},\"isPartOf\":{\"@id\":\"https://docs.velyti.com#website\"}}]}\u003c/script>\u003cscript data-mint-head type=\"application/ld+json\">{\"@context\":\"https://schema.org\",\"@type\":\"WebSite\",\"name\":\"Velyti\",\"publisher\":{\"@type\":\"Organization\",\"name\":\"Velyti\"},\"provider\":{\"@type\":\"Organization\",\"name\":\"Mintlify\",\"url\":\"https://mintlify.com\"}}\u003c/script>","agentPointerHref":"/en/insights/dashboard.md","siteName":"Velyti","nav":{"global":null,"languages":[{"language":"es","default":true,"pages":[{"title":"es","href":"/es/insights/dashboard"}]},{"language":"en","groups":[{"group":"Get started","pages":[{"title":"Welcome to Velyti","icon":"house","href":"/en"},{"title":"Sign in","icon":"right-to-bracket","href":"/en/getting-started/sign-in"},{"title":"First steps","icon":"rocket","href":"/en/getting-started/first-steps"},{"title":"Find your way around","icon":"compass","href":"/en/getting-started/navigating"}]},{"group":"Inventory","pages":[{"title":"Vehicles","icon":"car","href":"/en/inventory/vehicles"},{"title":"Vehicle record","icon":"id-card","href":"/en/inventory/vehicle-record"}]},{"group":"Clients","pages":[{"title":"Clients","icon":"users","href":"/en/clients/clients"}]},{"group":"Contracts","pages":[{"title":"Contracts","icon":"file-contract","href":"/en/contracts/contracts"},{"title":"Documents","icon":"print","href":"/en/contracts/documents"},{"title":"Attorneys","icon":"user-check","href":"/en/contracts/attorneys"}]},{"group":"Procedures","pages":[{"title":"Procedures","description":"Follow each transit procedure from draft to filed, approved or rejected, and keep an eye on the 60-working-day term.","icon":"clipboard-check","href":"/en/procedures/procedures"}]},{"group":"Insights","pages":[{"title":"Home","icon":"gauge","href":"/en/insights/dashboard"},{"title":"Reports","description":"Financial, inventory, sales and profitability reports for any period, with PDF, Excel and CSV downloads.","icon":"chart-line","href":"/en/insights/reports"},{"title":"Demand forecast","icon":"chart-mixed","href":"/en/insights/forecast"}]},{"group":"Administration","pages":[{"title":"My company","icon":"building","href":"/en/administration/company"},{"title":"Users and roles","icon":"users","href":"/en/administration/users-and-roles"},{"title":"Profile and settings","icon":"user-gear","href":"/en/administration/profile-and-settings"},{"title":"Plan and billing","icon":"credit-card","href":"/en/administration/subscription"},{"title":"Migration","icon":"box-archive","href":"/en/administration/migration"}]},{"group":"Help","pages":[{"title":"Glossary","icon":"book","href":"/en/help/glossary"},{"title":"Support","icon":"life-ring","href":"/en/help/support"}]}]}]},"basePath":"","title":"Home - Velyti","buildId":"dpl_Fyv1NbzwP68g2bEH2Roy98uY1zmE","deploymentId":"dpl_Fyv1NbzwP68g2bEH2Roy98uY1zmE","dynamics":["07c022d89b","a74be98ba7"],"chunks":["Frame-D2acuaLg.js","DynamicMarkdown-Co5nikxh.js","zoom-image-lightbox-BbK2OBGL.js","lightbox-handle-r17bVUz3.js"]}